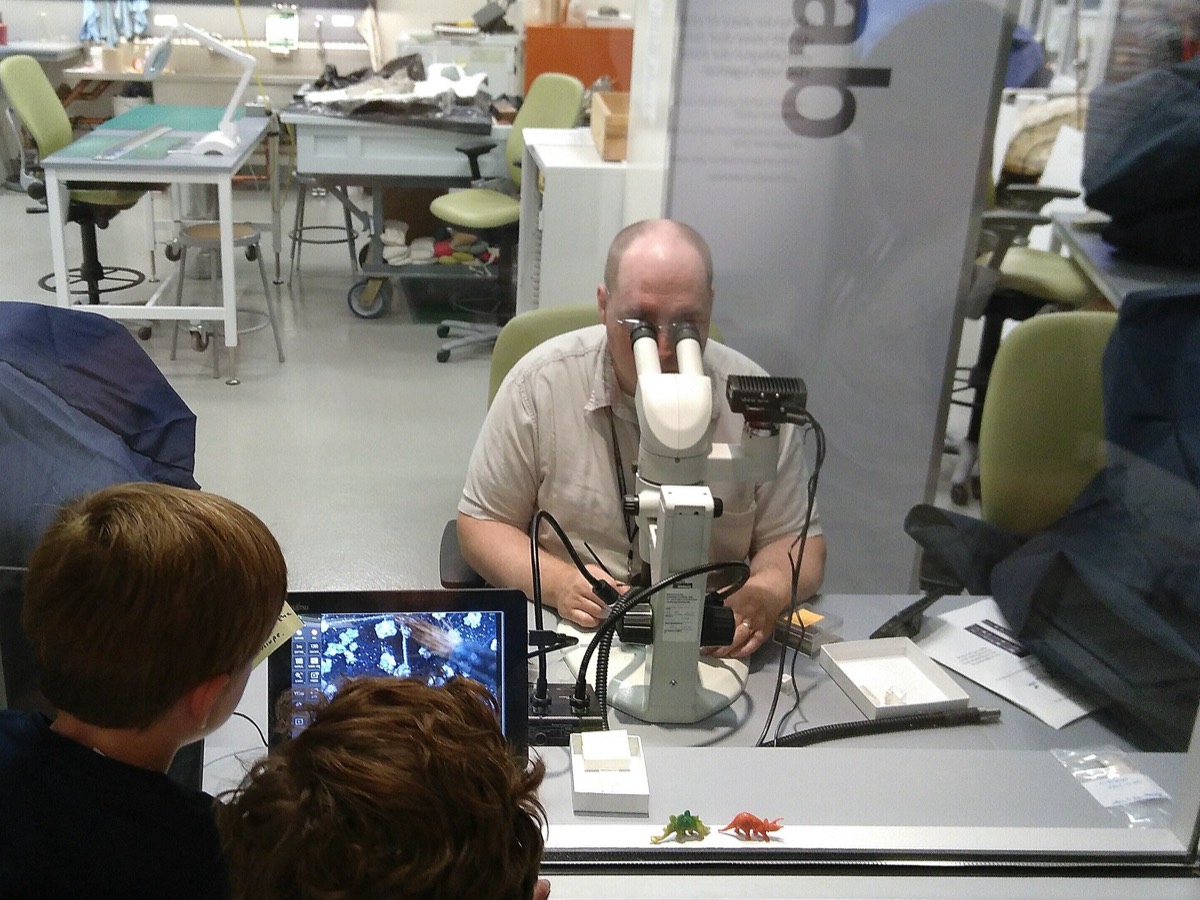
At the Galleria Borghese in Rome, Centorrino and colleagues did. Visitors carried portable while fixed sat in the museum rooms. Two algorithms cleaned the signal strength readings, and the result was visitor trajectories reconstructed accurately at the scale of individual rooms.
From those paths the authors built a model that generates new ones. Clustering the trajectories, using an original distance measure for comparing whole paths, revealed the most common flow patterns. Those produced a of room-to-room movement probabilities, which drives a stochastic capable of generating visitor trajectories in silico.
The study is an all-around look at visitor flow in a crowded museum, combining field measurements that follow individuals with statistical analysis. The case is the Galleria Borghese in Rome, where the authors ran a real-life data acquisition campaign rather than working from simulations or ticket counts.
The instrument is deliberately cheap. Raspberry Pi receivers sat in fixed positions throughout the museum rooms, and visitors were handed portable Bluetooth Low Energy beacons. Receivers record signal strength rather than location, so two algorithms do the translating: a sliding window-based statistical analysis and a neural network, which together filter the readings and reconstruct visitor trajectories at room scale.
Analysis then moves from paths to patterns. A clustering analysis, built on an original distance metric for comparing whole trajectories, yields behavioral insights including the most common flow patterns. On that basis the authors build the transition matrix describing, in probability, the room-scale visitor flows, and that matrix is the cornerstone of a stochastic model that can generate visitor trajectories in silico.
The payoff is operational. The simulator is used to improve how the museum can be experienced while respecting numerous logistic and safety constraints, through optimized ticketing and new entrance and exit management. Two cautions: this is one museum with its own layout, and the tracking resolves to rooms rather than to objects, so it says where people went and not what held them.
wat. Give visitors a beacon and a museum becomes a measurable flow problem.
wat wat
Crowding in a museum is usually managed by intuition and queue length. A simulator built from measured paths lets you test a ticketing change before imposing it on anyone.
How do we know?
A real-life data acquisition campaign at the Galleria Borghese combined fixed Raspberry Pi receivers with beacons carried by visitors, and used a sliding-window statistical analysis and a neural network to filter the signal strength.
What is still unknown
One museum, and the method resolves movement only to room scale rather than to individual objects. Visitors also had to carry a beacon, which selects who gets measured and may change how they behave.
Learn something?
Where to next
 Which bird travels between both poles every single year?tracking
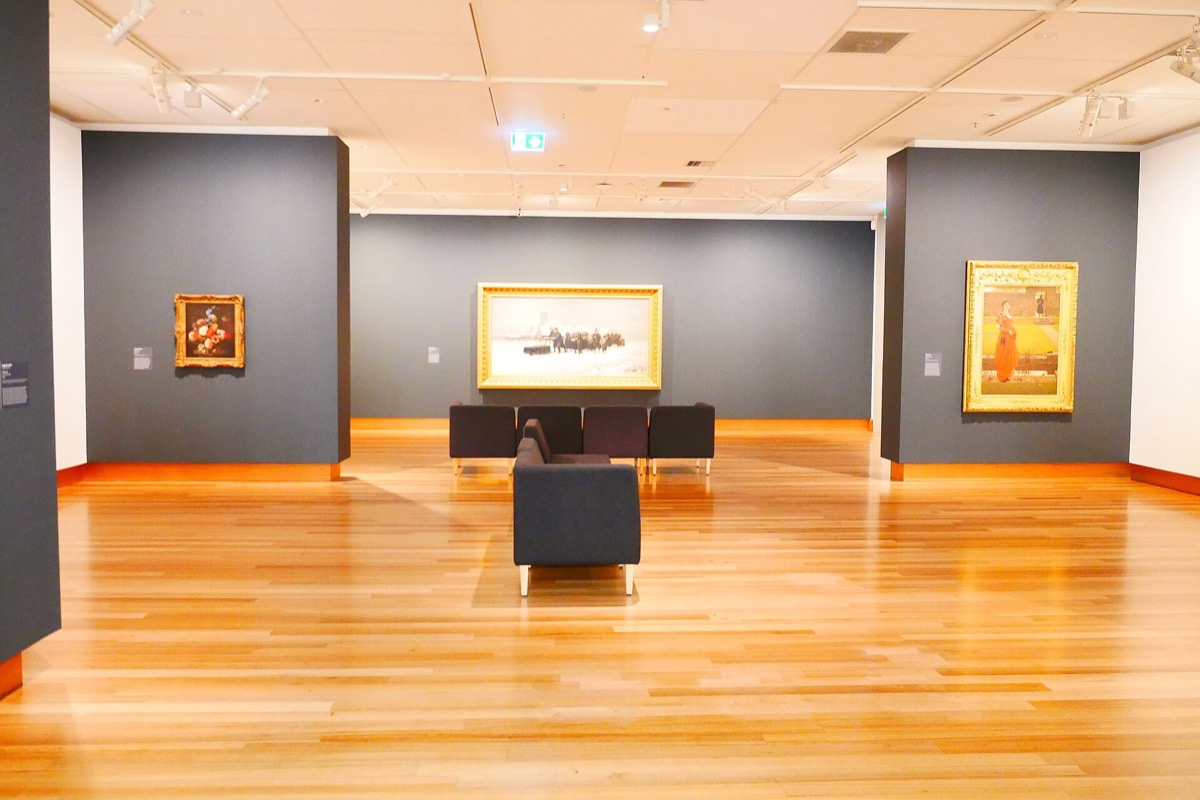 What does an explanation beside a painting do to the way we look?museums
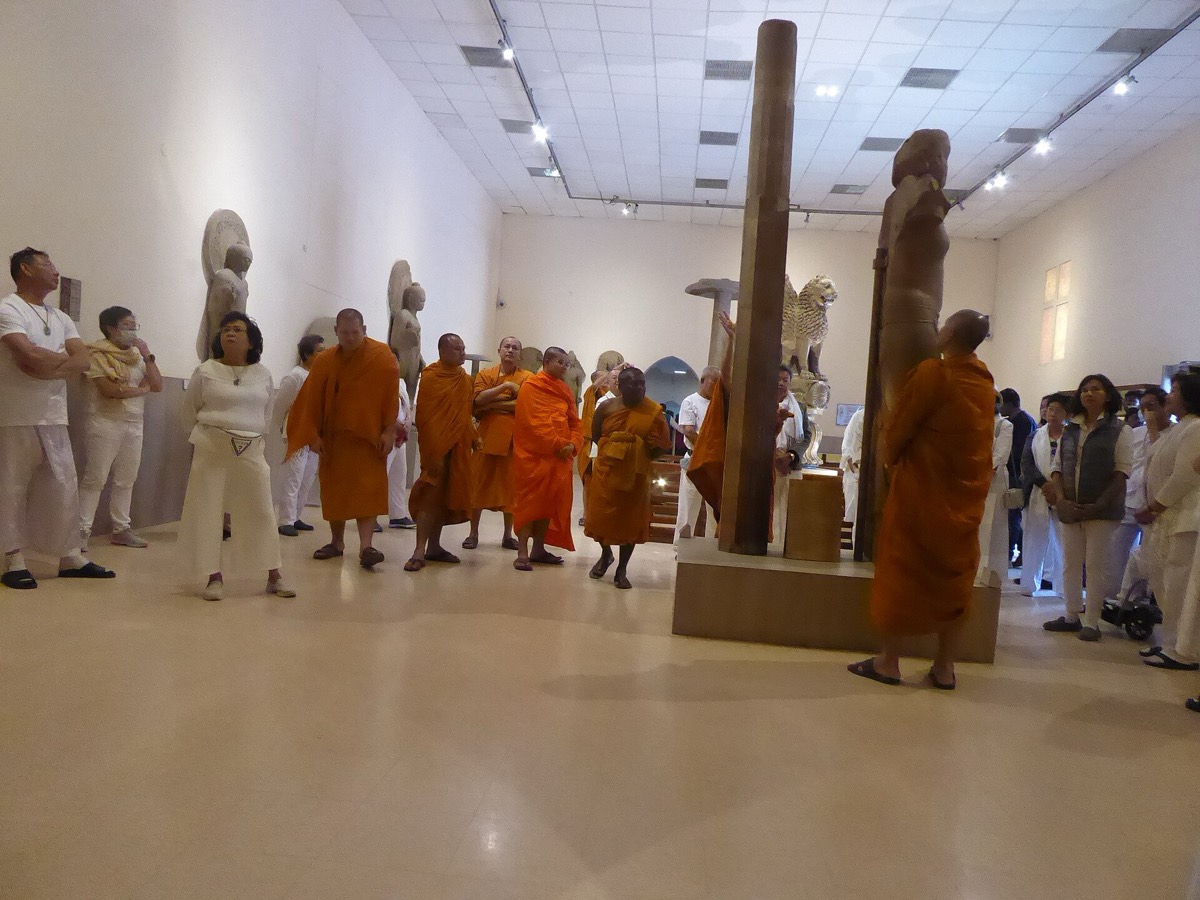 Can a wristband reading your pulse change what you remember from a museum?museums