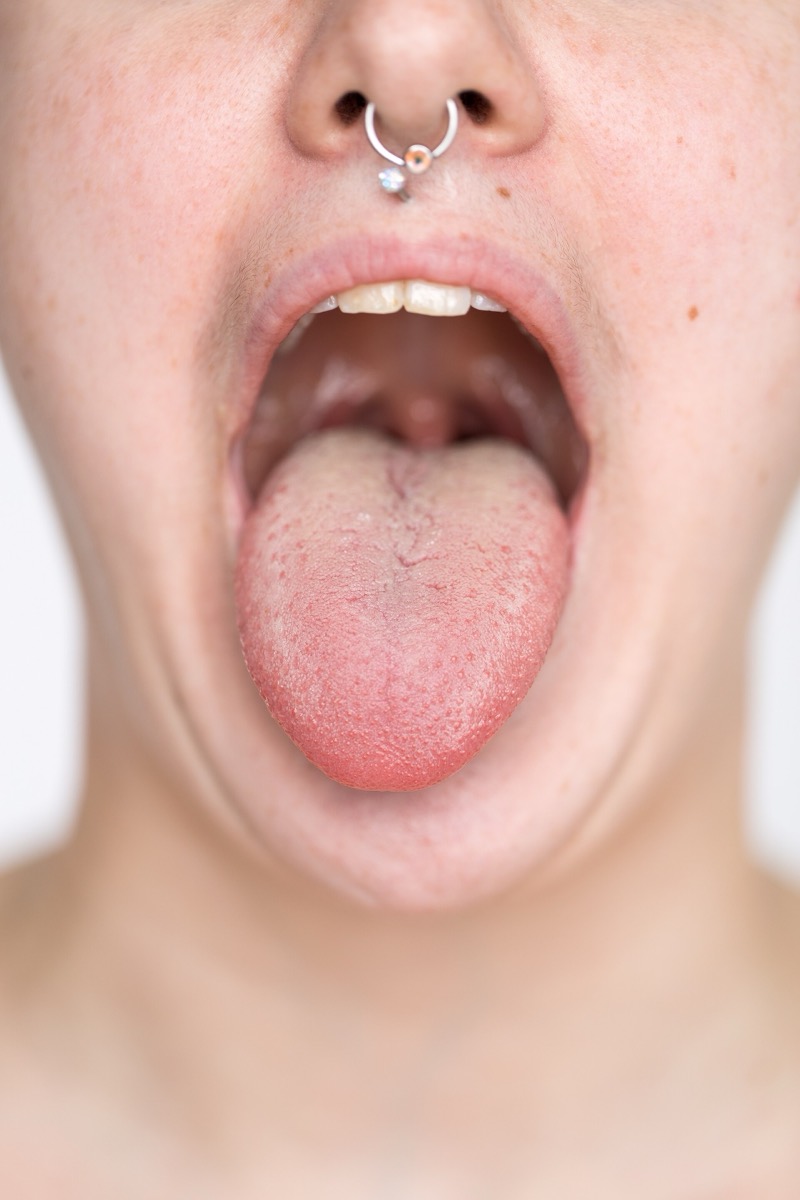
The is probably the most recognizable diagram in the study of taste: sweet at the front, salty and sour along the sides, bitter at the back. It is still printed in textbooks and taught in classrooms. Chemosensory scientists debunked it long ago, which raises a better question than whether it is wrong. Where did a wrong diagram come from?
From a graph that was misread, twice. Receptors for sweet, salty, sour and bitter are distributed all over the tongue. A 1901 paper by David Hänig measured around the tongue’s edge and found small variations, then presented them as a line graph of relative change, which looked like different regions owning different tastes. In the 1940s Edwin Boring redrew that graph without a meaningful scale.
Everybody has seen the tongue map, that diagram with sections neatly cordoned off for different tastes. It is possibly the most recognizable symbol in the study of taste and it is wrong, debunked by chemosensory scientists long ago. The receptors that pick up sweet, salty, sour and bitter are distributed all over the tongue.
The map has a traceable origin. A 1901 paper by the German scientist David Hänig measured thresholds for taste perception around the edges of the tongue, dripping stimuli at intervals. The tip and edges are indeed particularly sensitive, and Hänig found some variation in how much stimulus it took for a taste to register. His hypothesis generally holds up, and the differences are minute.
The trouble was presentation. Hänig published a line graph plotting the relative change in sensitivity for each taste from one point to the next, not against the other tastes. That was more an artistic interpretation than a representation of his measurements. In the 1940s the Harvard psychologist Edwin Boring reimagined that graph in a book, again without a meaningful scale, and each taste’s most sensitive area ended up sectioned off.
Three lines of evidence have refuted it since. Experiments indicate all areas of the mouth containing taste buds, including the soft palate and the throat, are sensitive to all taste qualities. Nerve work showed sweet surviving the cutting or anesthetizing of the . And turn out to be distributed across all taste areas rather than localized. The test needs no laboratory: touch a salted pretzel to the tip of the tongue.
wat. Taste receptors sit all over the tongue, and the map in the textbook is a century-old graph redrawn without its scale.
wat wat
It is a case study in how a figure outlives its data. Hänig’s measurements were not wrong; the way he drew them turned minute differences in threshold into tidy exclusive territories, and the picture traveled while the numbers stayed behind.
How do we know?
Smithsonian Magazine, reprinting The Conversation, traces the map to Hänig’s 1901 threshold measurements and Boring’s 1940s redrawing, and sets both against nerve-cutting and anesthesia studies and the receptor proteins identified since.
What is still unknown
This is a magazine account by a chemosensory researcher rather than a single study, so it summarizes a body of work. The specific threshold differences Hänig found are described as real but minute rather than quantified here.
Learn something?
Where to next
 You were told you are a visual learner. Should you be taught only in pictures?education
 Are some people really "right-brained" and others "left-brained"?myths
 You were told cracking your knuckles causes arthritis. What did they find?myths